nuc.setupBEExp
- nucleardatapy.nuc.setup_be_exp.be_exp_tables()[source]
Return a list of the tables available in this toolkit for the experimental masses and print them all on the prompt. These tables are the following ones: ‘AME’.
- Returns:
The list of tables.
- Return type:
list[str].
- nucleardatapy.nuc.setup_be_exp.be_exp_versions(table)[source]
Return a list of versions of tables available in this toolkit for a given model and print them all on the prompt.
- Parameters:
table (str.) – The table for which there are different versions.
- Returns:
The list of versions. If table == ‘AME’: ‘2020’, ‘2016’, ‘2012’.
- Return type:
list[str].
- class nucleardatapy.nuc.setup_be_exp.setupBEExp(table='AME', version='2020')[source]
Instantiate the experimental nuclear masses from AME mass table.
This choice is defined in the variables table and version.
table can chosen among the following ones: ‘AME’.
version can be chosen among the following choices: ‘2020’, ‘2016’, ‘2012’.
- Parameters:
table (str, optional.) – Fix the name of table. Default value: ‘AME’.
version (str, optional.) – Fix the name of version. Default value: 2020’.
Attributes:
- D3n(Zref=50)[source]
Compute the three-points odd-even mass staggering (D3p_n) D3n(Z,N) = (-)**N * ( 2*E(Z,N)-E(Z,N+1)-E(Z,N-1) ) / 2
- D3p(Nref=50)[source]
Compute the three-points odd-even mass staggering (D3p_n) D3p(Z,N) = (-)**Z * ( 2*E(Z,N)-E(Z+1,N)-E(Z-1,N) ) / 2
- S2n(Zref=50)[source]
Compute the two-neutron separation energy (S2n) S2n(Zref,N) = E(Zref,N)-E(Zref,N-2)
- S2p(Nref=50)[source]
Compute the two-proton separation energy (S2p) S2p(Z,Nref) = E(Z,Nref)-E(Z-2,Nref)
- Zmax
maximum charge of nuclei present in the table.
- Type:
Attribute Zmax
- dist_nbNuc
attribute number of nuclei discovered per year
- dist_year
attribute distribution of years
- flagI
Attribute I.
- flagInterp
Attribute Interp (interpolation). Interp=’y’ is the nucleushas not been measured but is in the table based on interpolation expressions.otherwise Interp = ‘n’ for nuclei produced in laboratory and measured.
- isotones(Nref=50)[source]
Method which find the first and last isotones for N=Nref.
- Parameters:
Nref (int, optional. Default: 50.) – Fix the neutron number for the search of isotones.
Attributes:
- isotopes(Zref=50)[source]
Method which find the first and last isotopes for Z=Zref.
- Parameters:
Zref (int, optional. Default: 50.) – Fix the charge for the search of isotopes.
Attributes:
- label
Attribute providing the label the data is references for figures.
- nbLine
Attribute with the number of line in the file.
- nbNuc
Attribute with the number of nuclei read in the file.
- note
Attribute providing additional notes about the data.
- nucA
Attribute A (mass of the nucleus).
- nucBE
Attribute BE (Binding Energy) of the nucleus.
- nucBE_err
Attribute uncertainty in the BE (Binding Energy) of the nucleus.
- nucHT
Attribute HT (half-Time) of the nucleus.
- nucI
Attribute I (isospin asymmetry):
- nucN
Attribute N (number of neutrons of the nucleus).
- nucStbl
Attribute stbl. stbl=’y’ if the nucleus is stable (according to the table). Otherwise stbl = ‘n’.
- nucSymb
Attribute symb (symbol) of the element, e.g., Fe.
- nucYear
Attribute year of the discovery of the nucleus.
- nucZ
Attribute Z (charge of the nucleus).
- ref
Attribute providing the full reference to the paper to be citted.
- select(Amin=0, Zmin=0, interp='n', state='gs', nucleus='unstable', every=1)[source]
Method which select some nuclei from the table according to some criteria.
- Parameters:
interp (str, optional. Default = 'n'.) – If interp=’n’, exclude the interpolated nuclei from the selected ones. If interp=’y’ consider them in the table, in addition to the others.
state (str, optional. Default 'gs'.) – select the kind of state. If state=’gs’, select nuclei measured in their ground state.
nucleus (str, optional. Default 'unstable'. It can be set to 'stable', 'longlive' (with LT>10 min), 'shortlive' (with 10min>LT>1 ns), 'veryshortlive' (with LT< 1ns)) – ‘unstable’.
every (int, optional. Default every = 1.) – consider only 1 out of every nuclei in the table.
Attributes:
- select_year(year_min=1940, year_max=1960, state='gs')[source]
Method which select some nuclei from the table according to the discovery year.
- Parameters:
year_min
year_max
state (str, optional. Default 'gs'.) – select the kind of state. If state=’gs’, select nuclei measured in their ground state.
Attributes:
Here are a set of figures which are produced with the Python sample: /nucleardatapy_sample/nuc_setupBEExp_plot.py
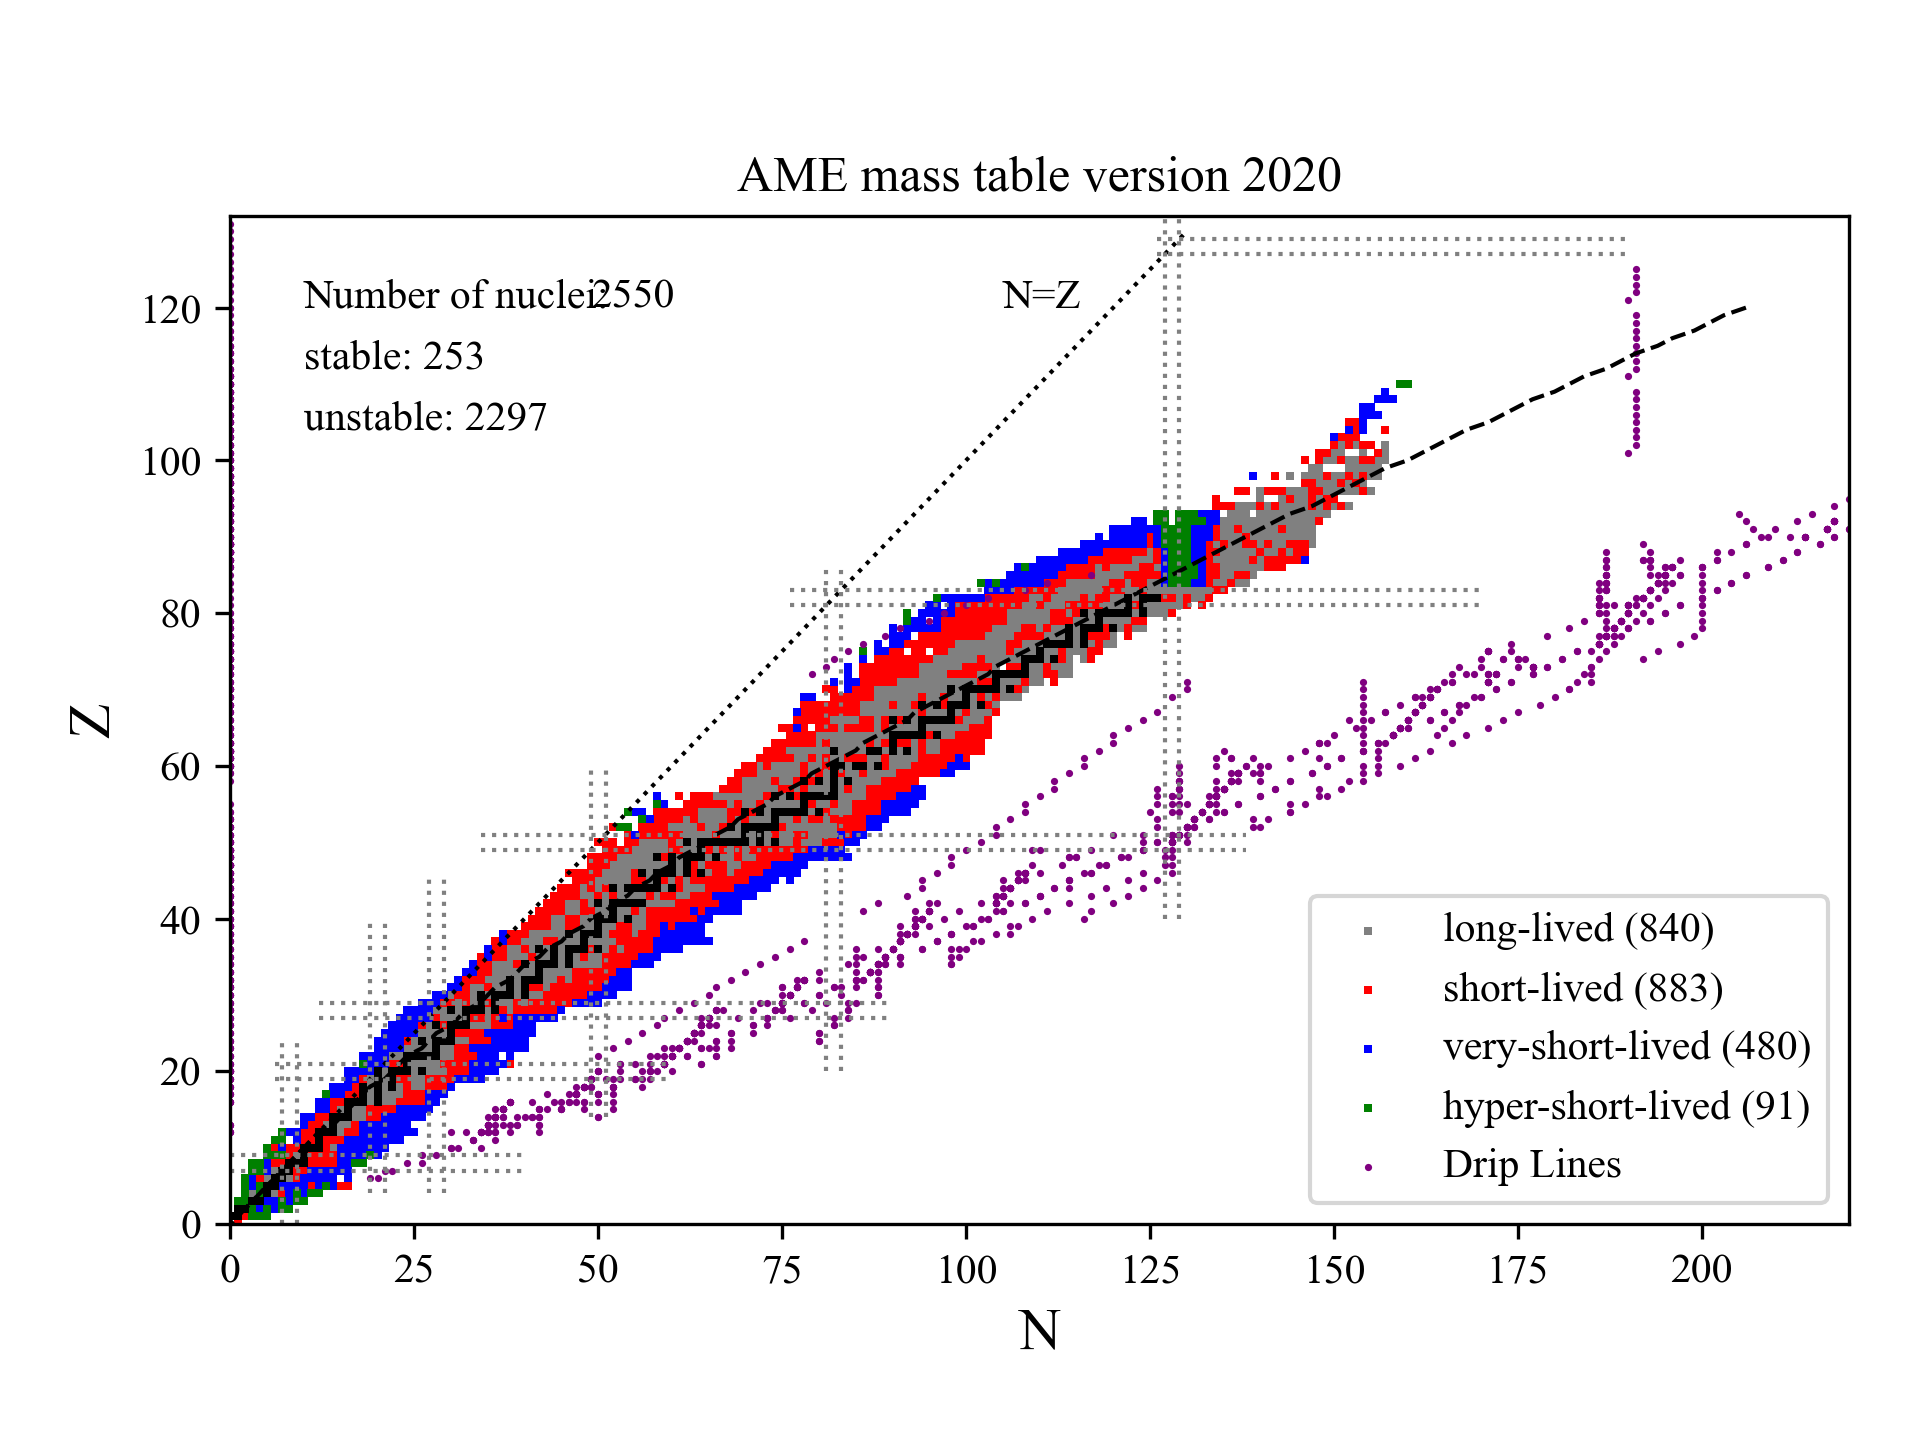
The nuclear chart based on AME 2020 table. The different colors correspond to the different measured half-times of nuclei.
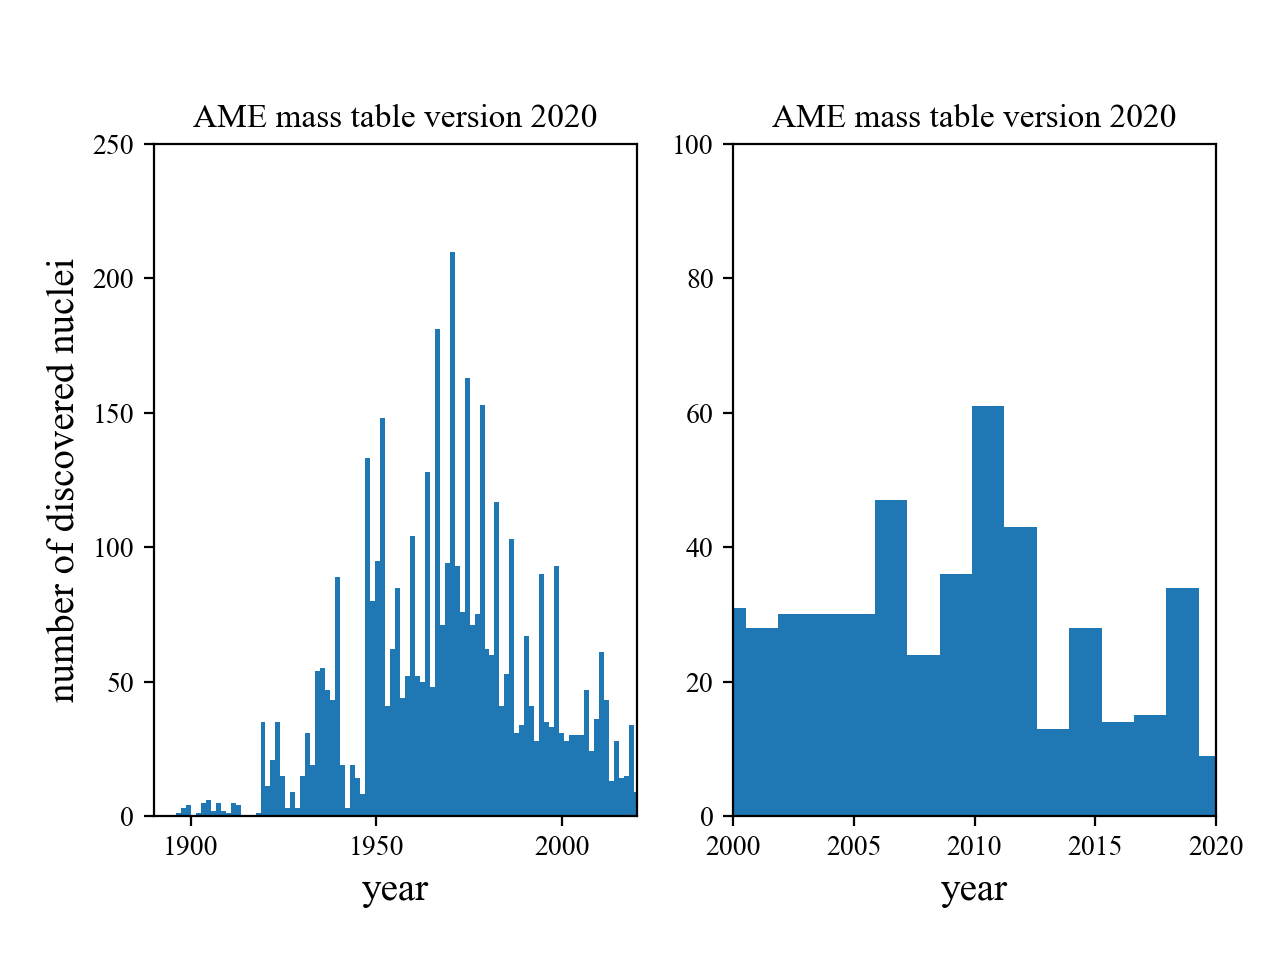
Histogram showing the distribution of nuclei per discovery year, since the first one discovered in 1897.